Objective: Generate usage reports.
Español
English
Português
Steps:
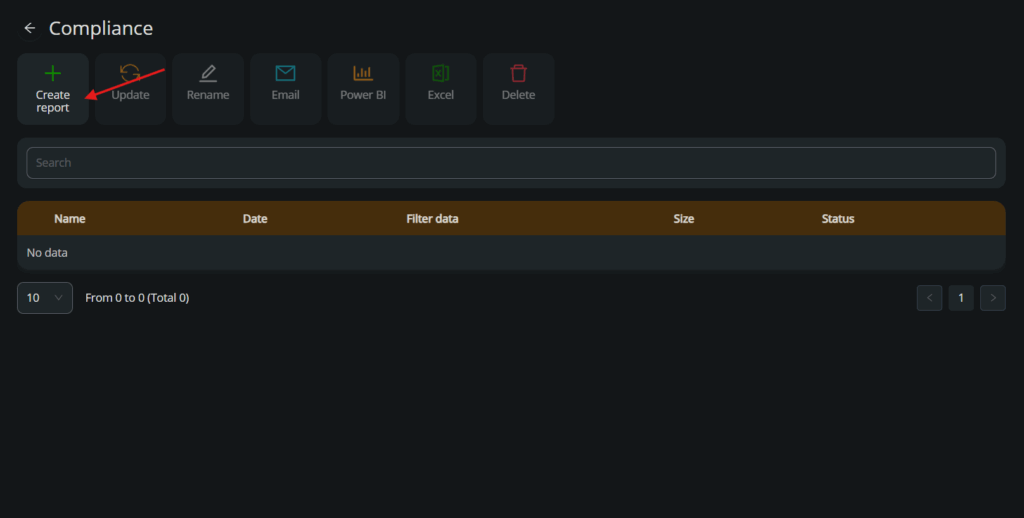
1. Generate an audit report #
Go to the Compliance module and click on Create report.
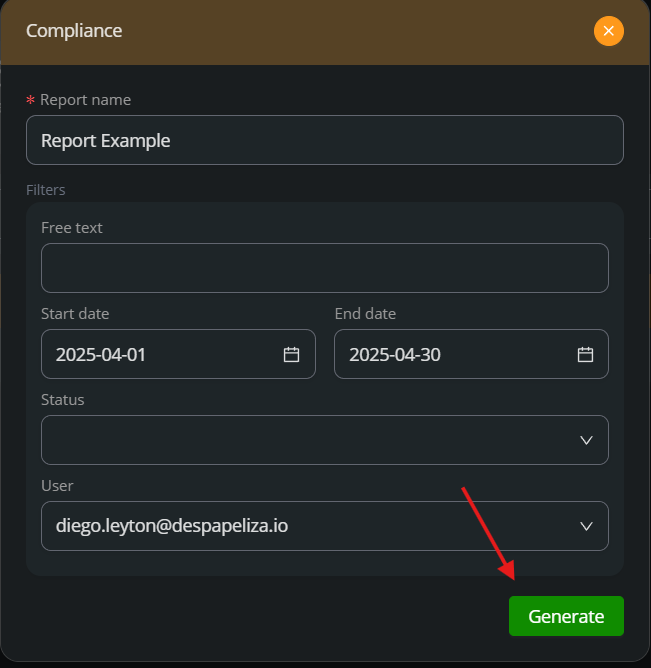
2. Prepare the audit report #
Set the name, date range, status, and user. Click Generate.
You can choose between the following status:
Uploaded
Ready for workflow
Ready to sign
In progress
Signed
Rejected
Flux paused
Approve or reject
Pending deletion
Terminated
Sign link expired
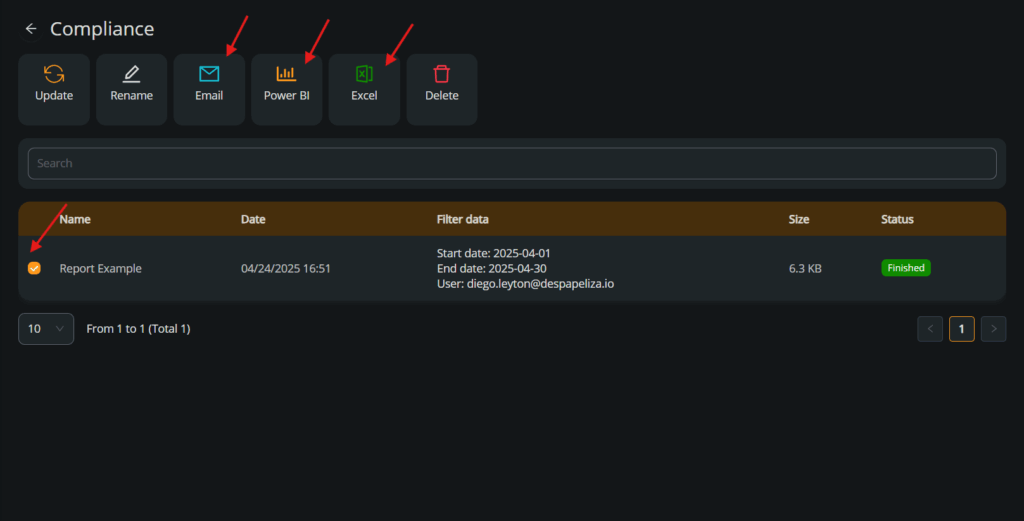
3. Export the audit report #
Once the report is generated, select it and use the Email, Power BI, or Excel buttons to export the report as needed.